|
Onetastic Macro Documentation >
>
Macro Debugging Macro Debugging
Macro Editor allows running macros step by step under the debugger via the
Debug > Start Debugging (F10) command or the Debug > Start Debugging (F10) command or the Debug > Run under Debugger (F5) command. This will switch the editor into the debugger mode and will display the next statement with a yellow background, activate the Object Browser with local variables: Run under Debugger (F5) command. This will switch the editor into the debugger mode and will display the next statement with a yellow background, activate the Object Browser with local variables:
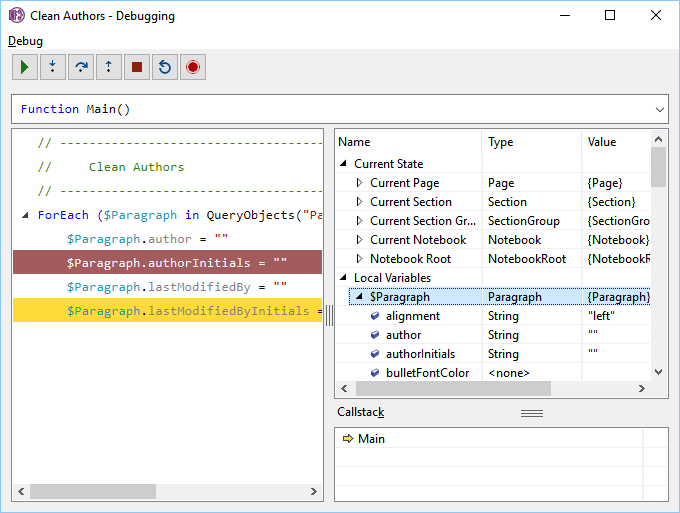
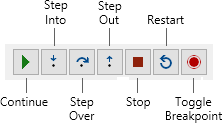
Once in the debugger mode, you can step through the macro and see the local variables in the Object Browser. Following menu and toolbar will appear in debug mode:
Breakpoints
You can set a breakpoint on a statement using Toggle Breakpoint button or the F9 key. This works both in the editor and in the debugger. The statements with a breakpoint will show with a maroon background and the debugger will stop when it hits one of the breakpoints.
Object Browser
Macro Debugger automatically displays the Object Browser on the right. Object Browser allows browsing OneNote hierarchy under Current Page, Section, Section Group, Notebook and under all notebooks. This way you can look into how the objects and their properties are stored in OneNote. This is also useful while editing a macro and can be activated using View >  Object Browser (Ctrl+J). Object Browser displays local variables currently in use in the macro under Locals section, allowing you to see the types and values of them. Object Browser (Ctrl+J). Object Browser displays local variables currently in use in the macro under Locals section, allowing you to see the types and values of them.
Demonstration
Watch the short video here to learn more about how to use these tools.
|