Powerful New Debugging Tools for Macros
Watch, Locals, Autos and a new VS Code Extension
April 18, 2026
If you have ever written a macro in Onetastic and found yourself wondering "what is that variable set to right now?" or "why is this loop not doing what I expect?", then this update is for you. Onetastic Macro Editor's debugger now includes three powerful new windows: Watch, Locals, and Autos. These additions bring a debugging experience similar to professional coding tools, right inside your macro editor.
What Are These Windows?
When you step through a running macro in the debugger, you now have three new windows to help you understand what is happening inside your macro at any given moment.
Locals
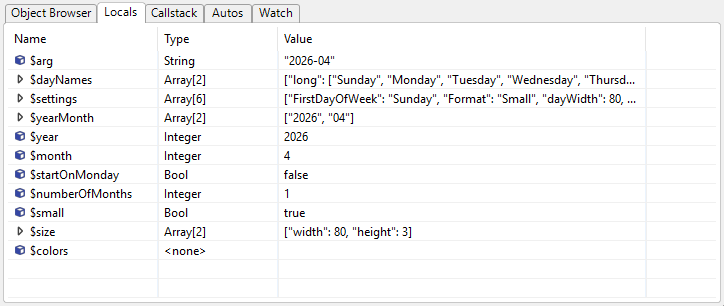
The Locals window automatically shows every variable that exists in the current function as you step through your code. Variables defined and used up to the current statement will automatically appear. As you step line by line, you can see variables being created and their values changing in real time.
The Locals window is also forward-looking: variables referenced on the very next line you are about to execute appear in the list even before they have been assigned a value. This means you can see at a glance which variables are about to come into play, not just the ones already defined.
Autos
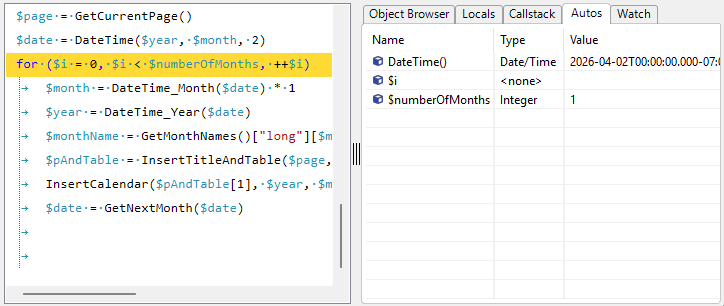
The Autos window is a smarter, focused version of Locals. Instead of showing every variable, it shows only the variables that are relevant to the current line, including the ones just used or about to be used. In addition it shows the function return values from the previous line that just got executed. This keeps the window concise so you can focus on what matters most at each step.
Watch
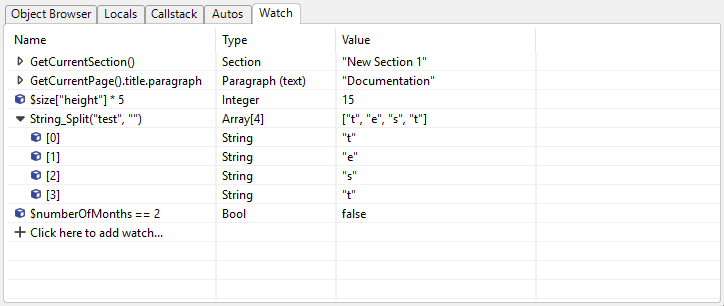
The Watch window lets you type in any expression and see it evaluated live as you step through your macro. Unlike Locals and Autos, you are in full control of what gets displayed. You can watch a single variable, a computed value, or a more complex expression like checking whether two variables are equal.
To add a watch expression:
- Click the Click here to add watch row at the bottom of the Watch window
- Type any expression (for example,
$myVar or $count + 1) - Press Enter to confirm
The expression will immediately be evaluated and its current value and type shown. After each step in the debugger, all watch expressions are automatically re-evaluated so you always see up-to-date values.
Adding to Watch from Other Windows
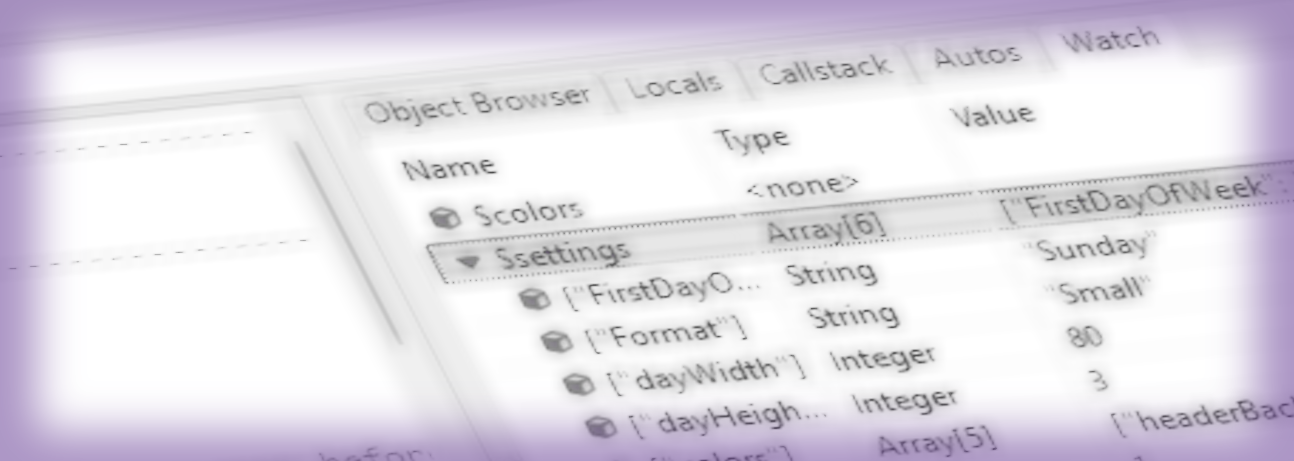
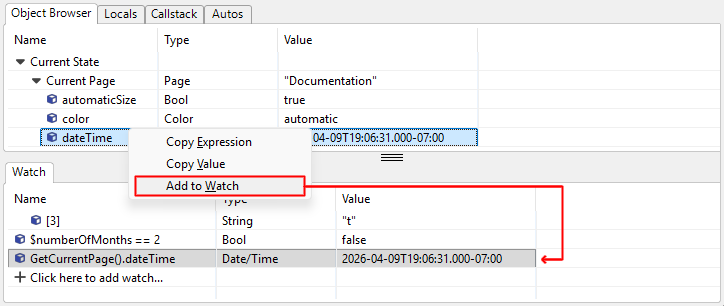
You do not always have to type expressions manually. In the Locals, Autos, or Object Browser windows, right-click any variable and choose Add to Watch. The expression is copied directly into the Watch window, ready to be tracked. This is especially handy when browsing a complex object and you want to keep an eye on one of its properties across multiple steps.
Editing and Removing Watch Expressions
To edit an expression, double-click it or press Enter while it is selected. To remove it, press Delete or right-click and choose Delete.
What If an Expression Has an Error?
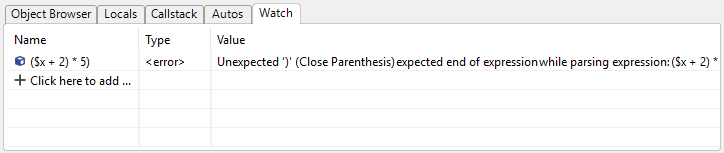
If you type an expression that has a syntax problem, or uses a function that cannot be used in a read-only context, the Watch window will not discard your entry. Instead, it will keep the expression and show <error> as the type along with a description of the problem in the value column. This lets you correct the expression without losing it.
Watch Expressions Are Remembered
Your watch expressions are saved for each macro separately. The next time you open and debug that same macro, your watch list is right where you left it. You do not need to re-enter your expressions every session.
All Windows Respect the Selected Call Stack Frame
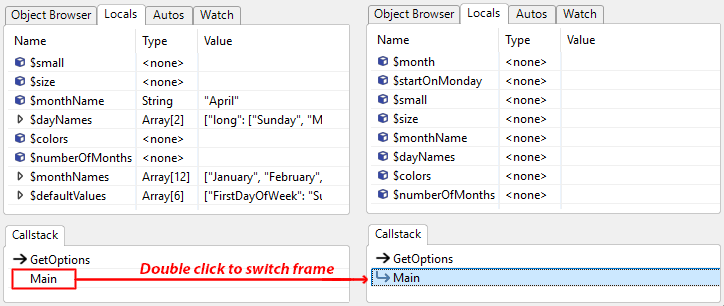
When you have a macro that calls other functions, the call stack shows you the chain of function calls that led to the current line. The Locals, Autos, and Watch windows all show values from whichever call stack frame you have selected, not just the current one. This lets you inspect variables in a parent function without having to navigate away.
Inspecting Variables Directly in the Code
Beyond the dedicated windows, you can also inspect and interact with variables right where they appear in your macro code, without switching windows or typing anything.
Hover to See a Variable's Value
While the debugger is paused, hover your mouse over any variable name in the code. A tooltip appears showing the variable's current value and type right at the cursor.
Ctrl+Click to Jump to Locals
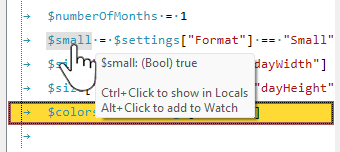
Hold Ctrl and click any variable in the code to jump straight to that variable in the Locals window. The Locals tab is brought to the front automatically and the variable is selected and scrolled into view. If the variable has not been assigned a value yet, it still appears in the list so you can see it is about to be used.
Alt+Click to Add to Watch
Hold Alt and click any variable in the code to instantly add it to the Watch window. The Watch tab is brought to the front and the newly added expression is selected. If the variable is already in your watch list, it is simply scrolled into view without being added twice.
Rearranging the Debugger Layout
One of the most convenient aspects of this update is that you are not stuck with a fixed layout. The debugger windows, along with the existing Call Stack and Object Browser windows, all live in tabbed panels. You can drag any tab from one panel to the other to create the layout that works best for you.
For example, if you prefer to have the Watch window alongside the Call Stack at the bottom and keep Object Browser on its own at the top, you can drag the Watch tab down. Or if you want all windows together in one place, drag them all to the same panel. Your arrangement is saved automatically and restored the next time you open the macro editor.
If you drag all tabs out of one panel, that panel hides itself to give more space to the other. When you start dragging again, the empty panel reappears so you can drop tabs back into it.
A Complete Debugging Experience
With Watch, Locals, and Autos added to the existing Call Stack and Object Browser, the Onetastic Macro Editor now offers a complete set of tools for understanding and diagnosing your macros. Whether you are tracking down a tricky bug or simply exploring how a macro behaves step by step, these windows give you full visibility into what is happening.
Here is a quick overview of all the debugger windows and what each one is for:
| Window | What it shows |
|---|
| Locals | All variables in the current function so far, including those about to be used on the next line |
| Autos | Variables relevant to the current line and function return values from the previous line |
| Watch | Expressions you choose to monitor |
| Call Stack | The chain of function calls leading to the current line |
| Object Browser | The full state of your macro, including local storage values |
And a quick reference for interacting with variables directly in the code editor while debugging:
| Action | Result |
|---|
| Hover over a variable | Tooltip shows its current value and type |
| Ctrl+Click a variable | Jumps to that variable in the Locals window |
| Alt+Click a variable | Adds the variable to the Watch window |
Improved VS Code Support
If you use VS Code as your macro editor, this update brings several improvements that make writing macros there much more enjoyable.
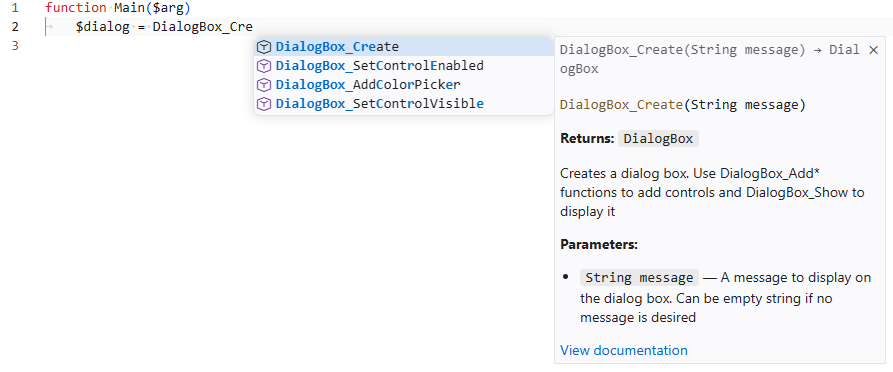
Auto-Complete for Functions
When you start typing a function name, VS Code will now show a list of matching Onetastic functions to choose from. Select one and press Enter or Tab to complete it. Each suggestion includes a short description so you can pick the right function without looking it up separately.
Function Details on Hover
Hover your mouse over any function name in your macro and a tooltip will appear showing the function's description, its parameters with their types, and its return type. This is handy when you want a quick reminder of what a function does or what arguments it expects, without leaving the editor.
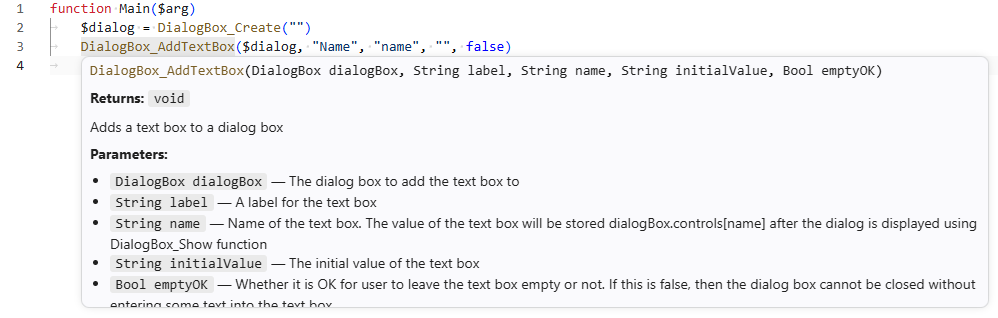
Parameter Hints While Typing
When you type a function name followed by an opening parenthesis, VS Code now shows a popup with the function's parameter names and types. As you type each argument and move to the next one, the current parameter is highlighted so you always know which argument you are filling in.
Open Function Documentation
Press F12 or Ctrl+Click on any function name to open its full documentation page on the Onetastic website in your browser. This gives you quick access to detailed descriptions and examples for any function.
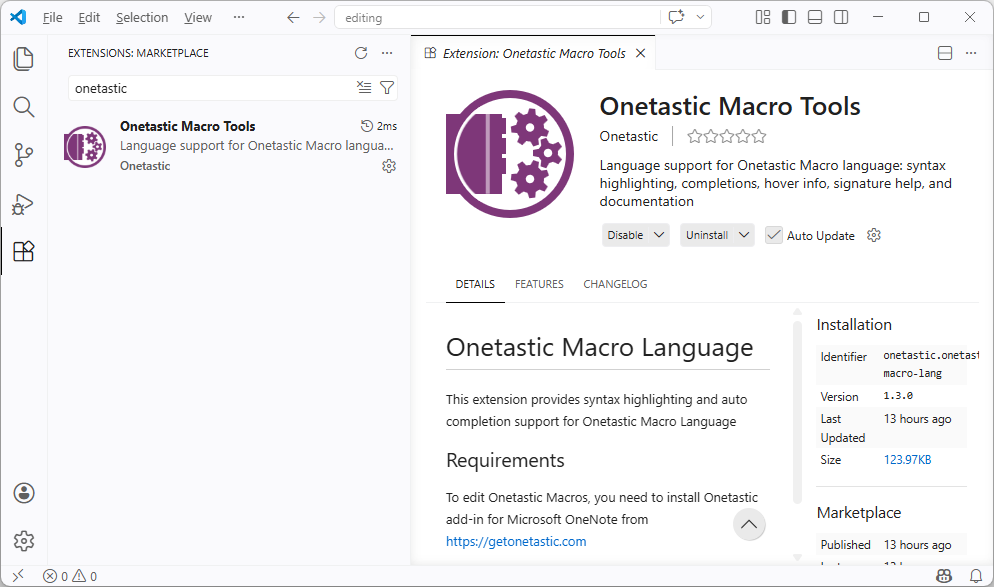
Extension Now Available on the VS Code Marketplace
The Onetastic Macro Tools extension is now published to the VS Code Marketplace. When you click Edit in VS Code in Onetastic for the first time, the extension is installed automatically from the marketplace. If you had an older version installed, it will be replaced with the new one automatically as well.
You can also find and install it manually by searching for Onetastic Macro Tools in the VS Code Extensions panel.
We hope these new tools make writing and debugging macros a much smoother experience. If you have feedback or questions, join the discussion below or reach us out via email.
Comments